Data & technique
Horse jump trajectory: what the curve reveals
How to read the real jump trajectory of your horse measured by Alogo Move Pro, and what makes it change: approach, footing, fence type, age and tack.
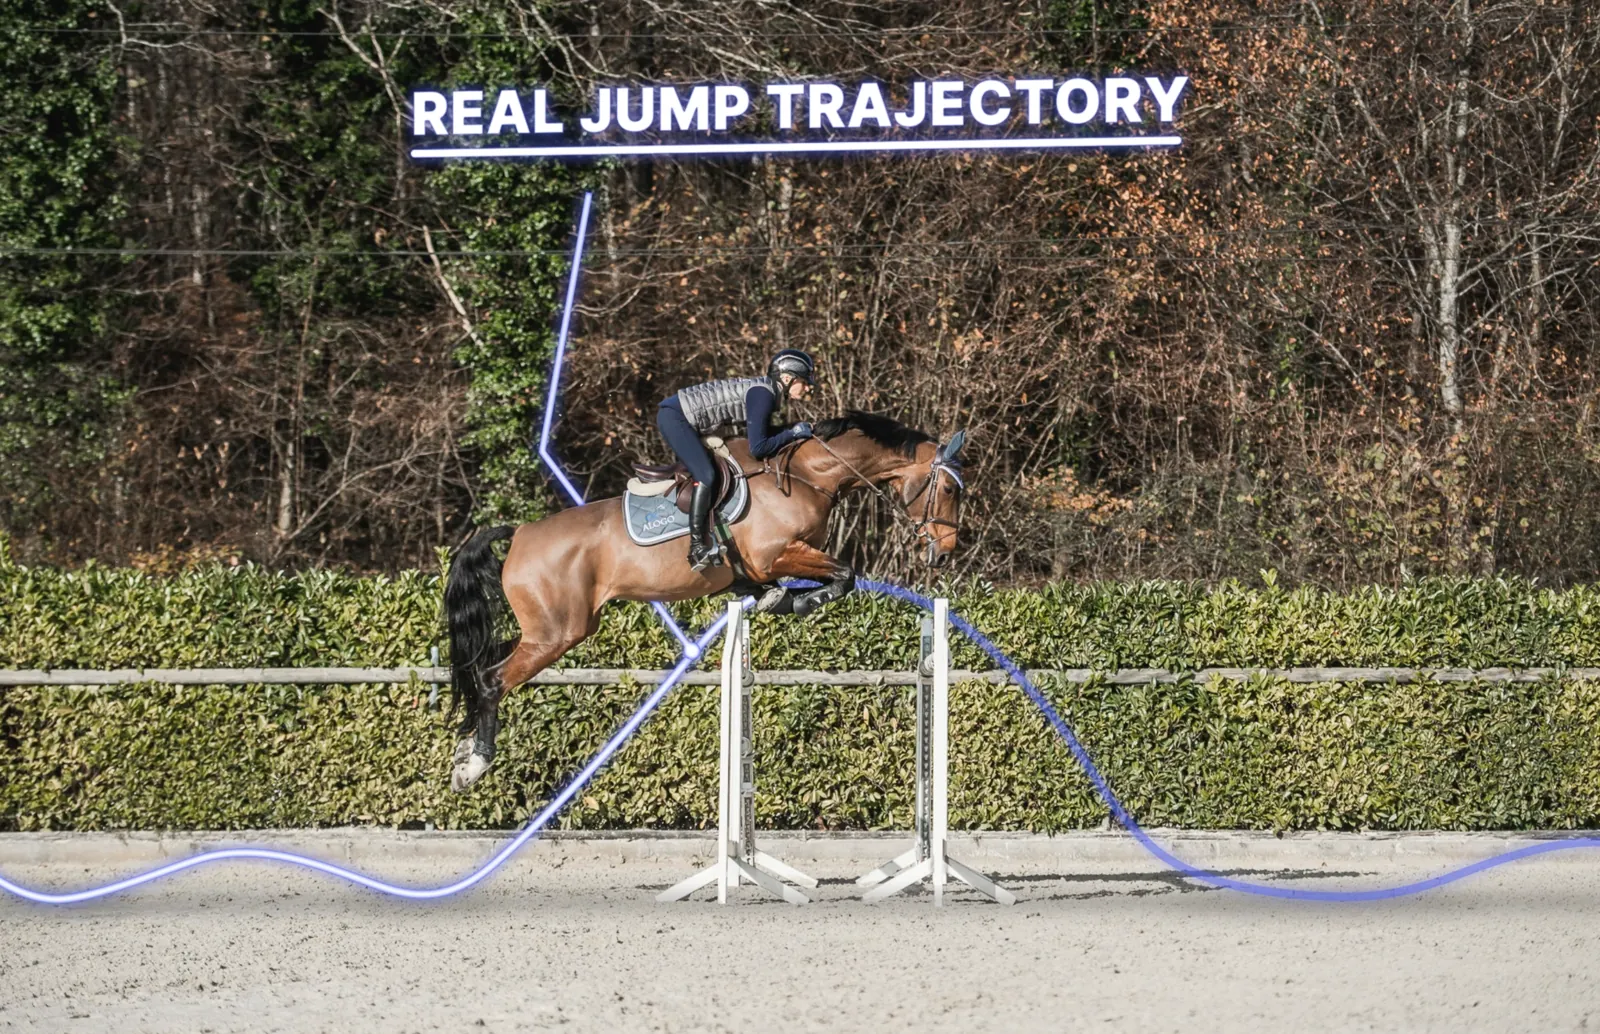
The real trajectory of a jump is the curve your horse draws in space, from take-off to landing. Using its inertial measurement unit and its GPS, the Alogo Move Pro sensor reconstructs that curve for every jump. Each horse has its own, and it changes with many factors, detailed below: a way to follow a horse's progress, or to compare the jumping technique of two horses.
A curve that is never a perfect parabola
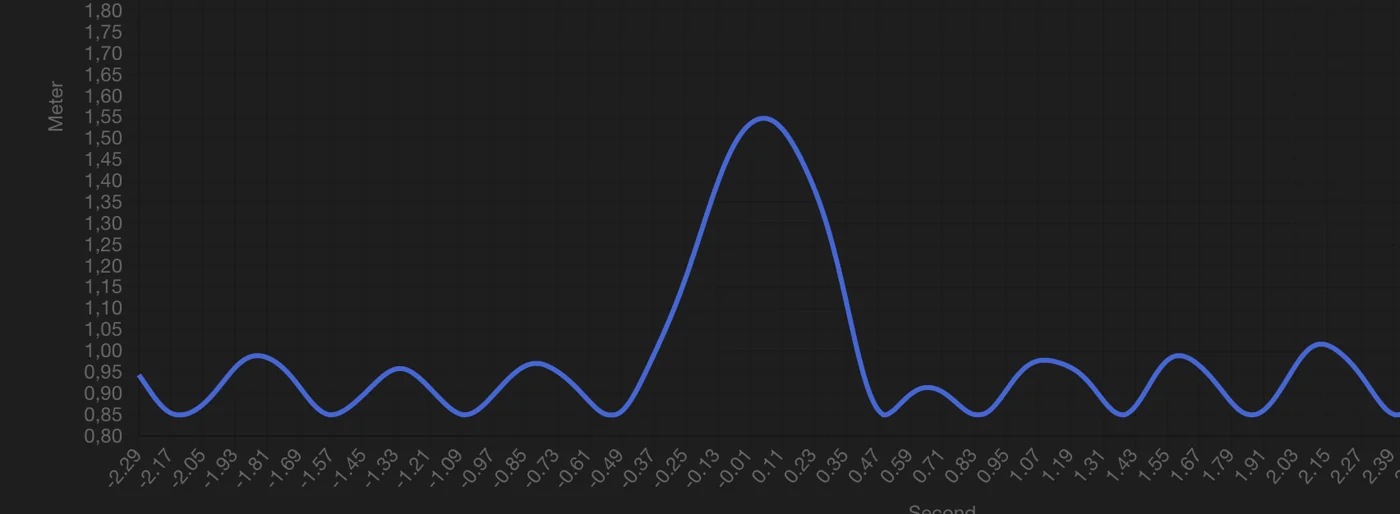
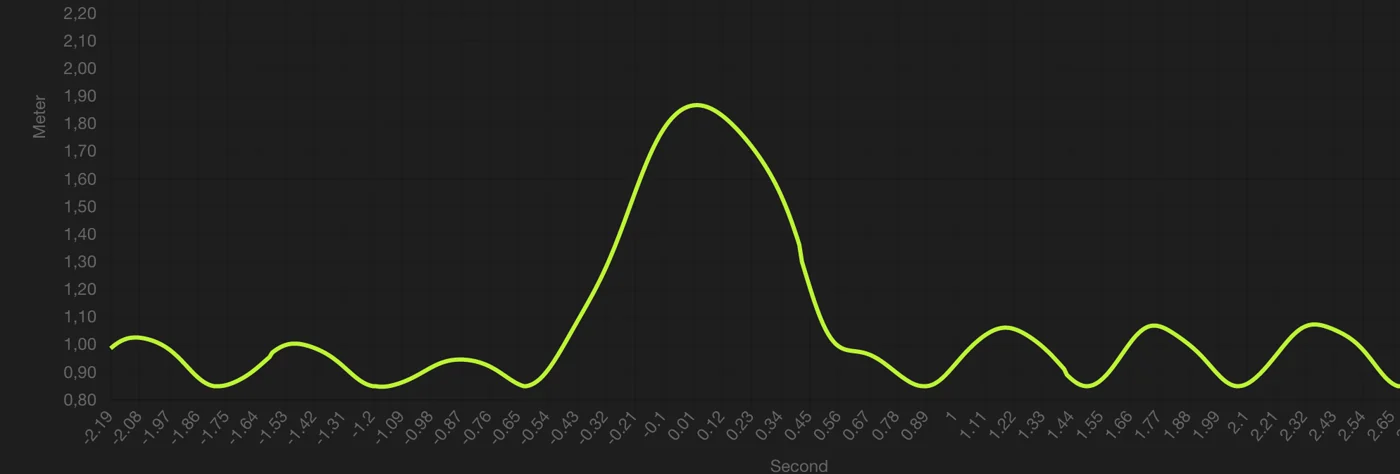
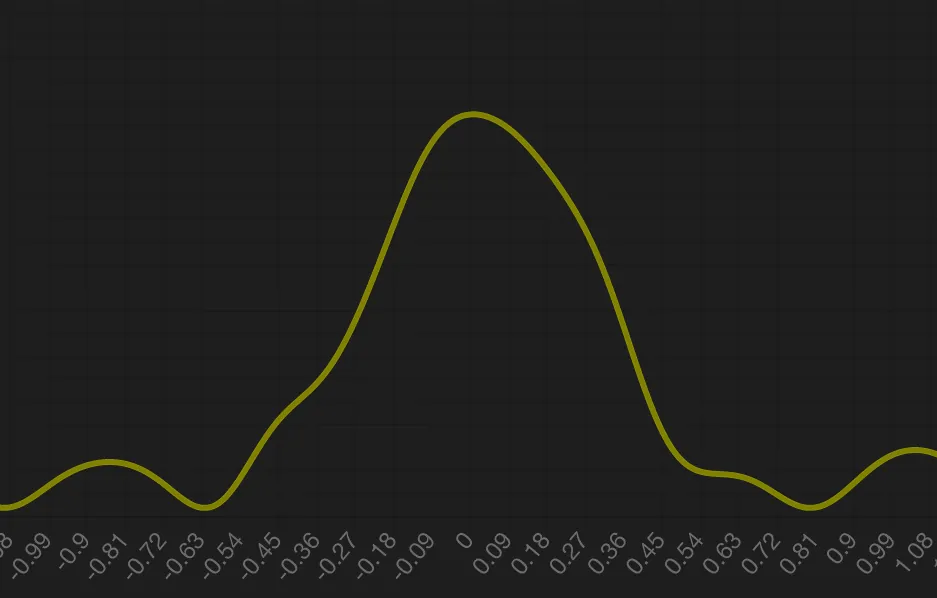
Contrary to popular belief, the trajectory of a jump is not a smooth, regular and perfectly symmetrical parabola from take-off to landing.
In the Alogo app, every jump of the session is measured: its height, its length and the shape of its trajectory. Jumps that stand out from your usual ones are flagged, and trajectories can be compared with each other to understand how, and why, two jumps were so different.
What changes the trajectory of a jump
- Canter quality, accuracy of the approach and session intensity. A horse that meets the fence too close does not jump like a horse that stands off too far, and the trajectory often changes between the start and the end of a session. The data helps you dose the workload so your horse progresses without going into the red zone: when the quality of the jumps and of the canter drops, performance follows, and the risk of injury rises.
- Type and quality of the footing. Depending on the horse, the difference between grass and sand is more or less marked, as it is between good and poor ground. You learn on which surfaces your horse jumps best and feels most comfortable.
- The fence profile. At the same height, the top of the curve is usually longer and flatter over an oxer than over a vertical. Fixed cross-country fences also produce flatter trajectories than the knock-down fences of show jumping.
- The horse's age and experience. Jumping technique evolves, and so does the curve. You see a young horse's progress in concrete terms and adapt your riding over time.
- Tack. A new bit, a training aid, another saddle: even fine variations show up in the shape of the trajectories.
For professional riders, it is also a way to test different ways of riding to a fence and to find the most efficient one for each horse.
Same course, two jumping techniques
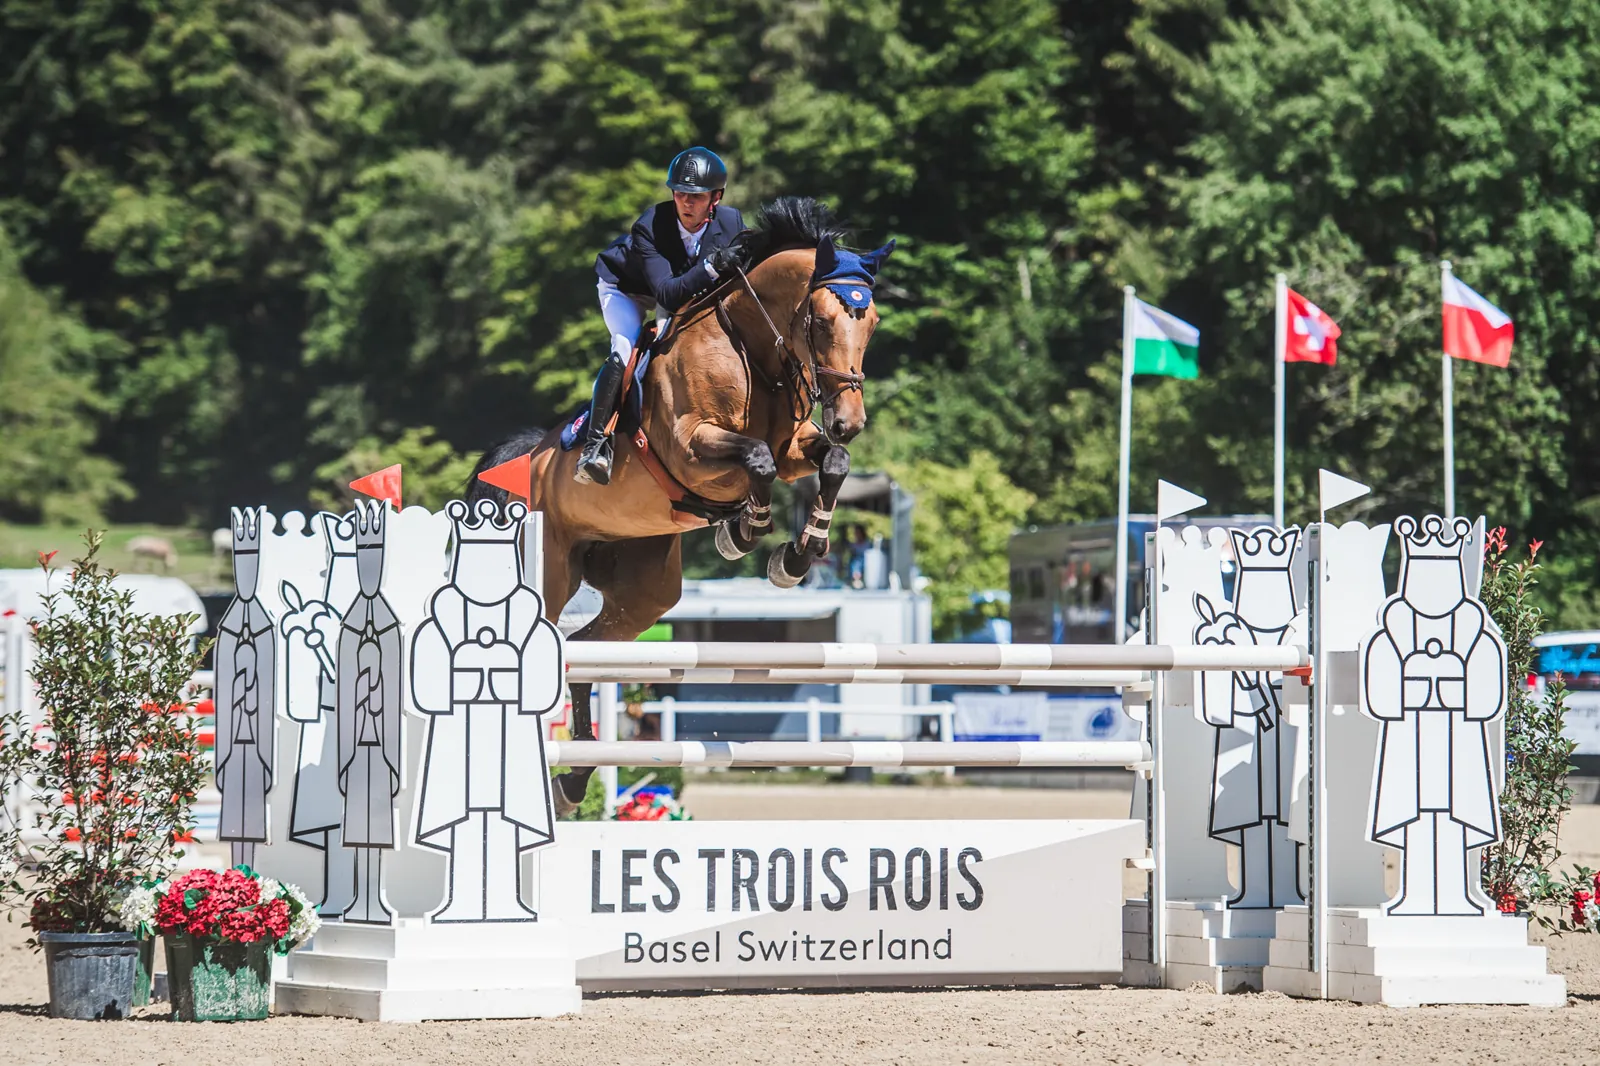
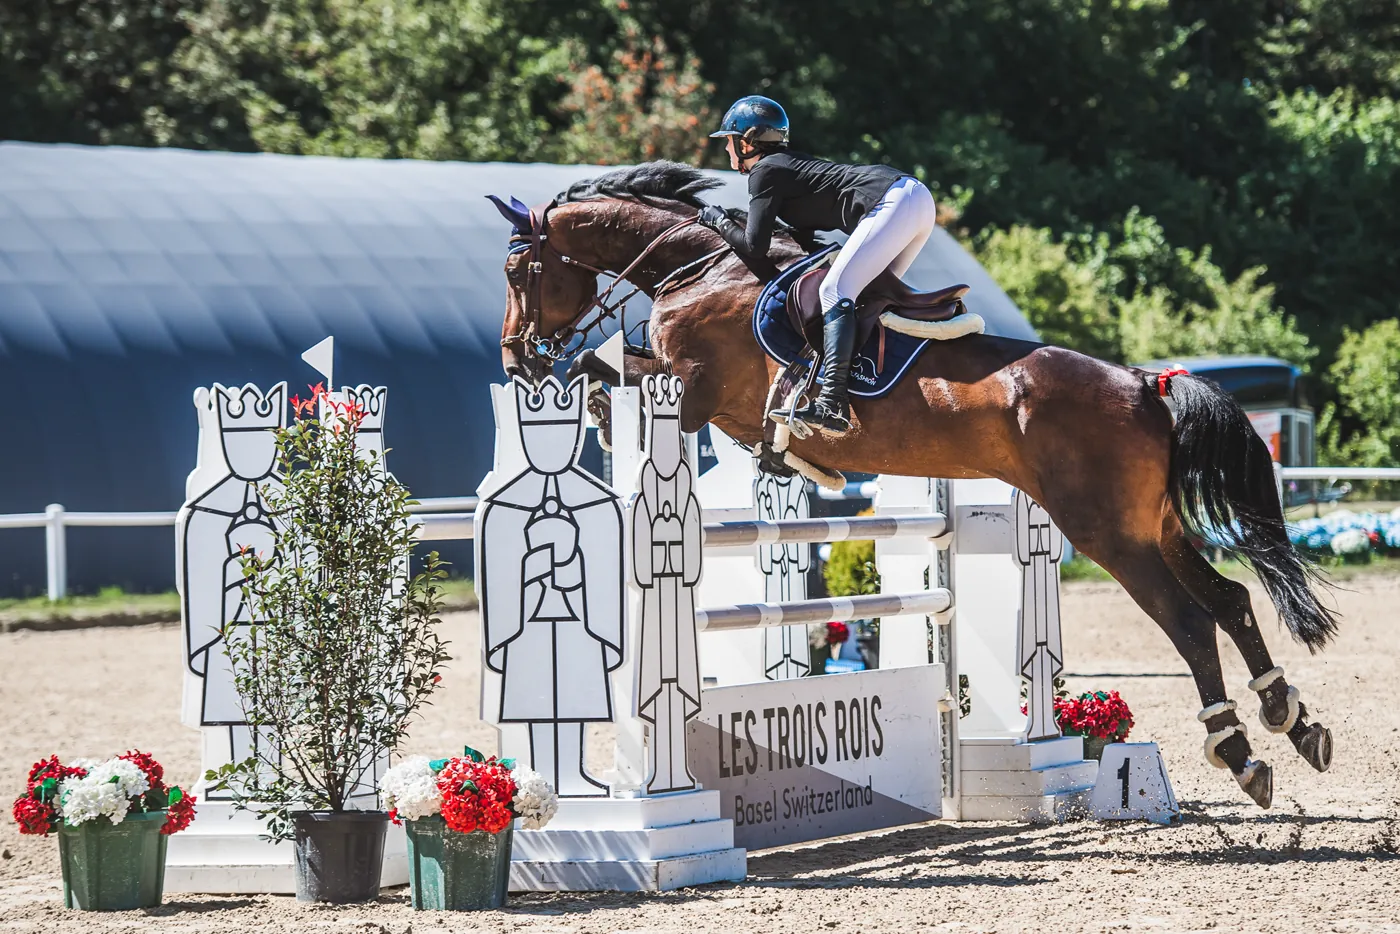
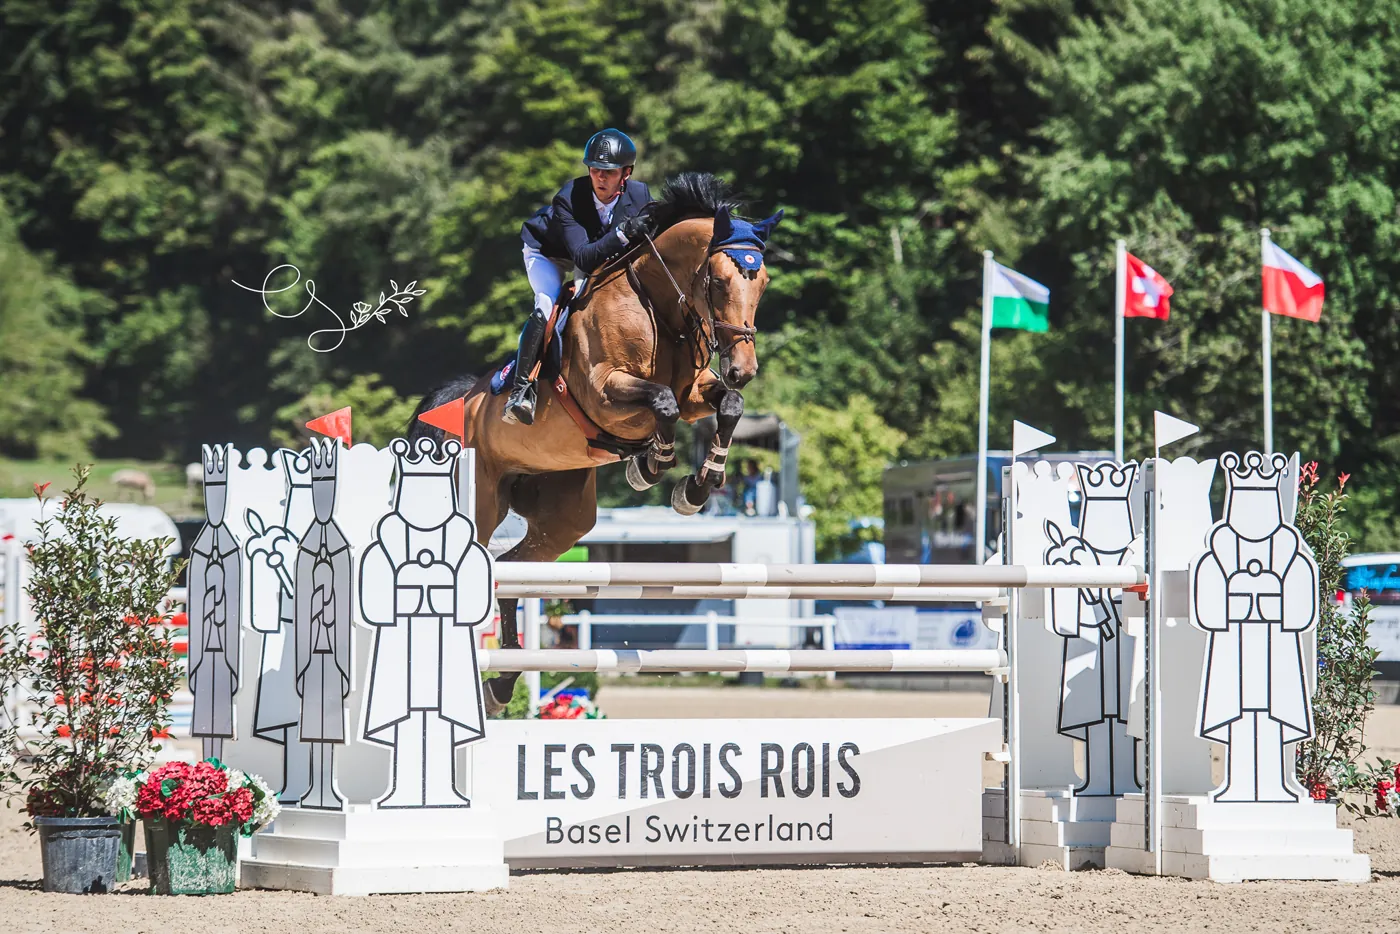
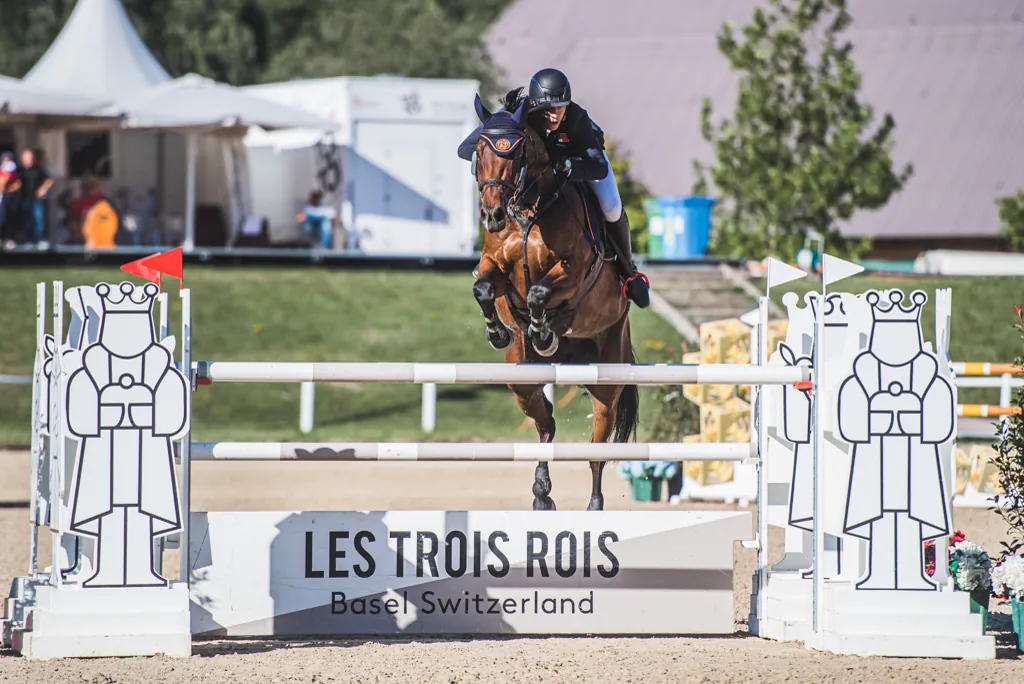
In the images below: same course, same fence height and width, same approach. And yet two very different jumping techniques, and therefore two very different trajectories.
Did you know? The "wave" at take-off and landing
With some horses, a small wave appears on the curve during the ascending phase. It is neither an error nor a bug, but a matter of technique: it mostly shows when the horse folds its forelegs in two stages. In the first, as it pushes off the ground, it bends them only slightly. In the second, it lifts its knees higher, tucks its forelegs under its body and stretches to clear the width of the fence or gain a few more centimetres.
On landing, another wave appears as the horse lands on one foreleg and then on the other. About 95% of horses land this way, on one leading leg; very few land on both forelegs at once, as Trésor, Steve Guerdat's former Grand Prix horse, used to do (source: Dr Stéphane Montavon, veterinarian).
Going further
The trajectory is best read together with the rest of the session data: stride length and height, your horse's balance and the GPS track. The accuracy of the sensor's measurements has been validated against a laboratory optical motion capture system (Guyard et al., Sensors, 2023). To see the jump-by-jump analysis, have a look at Alogo Performance.
Photos: Soraya Exquis.
First published in 2020 on our former blog, this article has been updated. Some screenshots show an earlier version of the Alogo app.